


Official Google Webmaster Central Blog |  |
| Structured Data dashboard: new markup error reports for easier debugging Posted: 12 Dec 2013 06:02 AM PST Since we launched the Structured Data dashboard last year, it has quickly become one of the most popular features in Webmaster Tools. We've been working to expand it and make it even easier to debug issues so that you can see how Google understands the marked-up content on your site. Starting today, you can see items with errors in the Structured Data dashboard. This new feature is a result of a collaboration with webmasters, whom we invited in June to>register as early testers of markup error reporting in Webmaster Tools. We've incorporated their feedback to improve the functionality of the Structured Data dashboard. An "item" here represents one top-level structured data element (nested items are not counted) tagged in the HTML code. They are grouped by data type and ordered by number of errors:
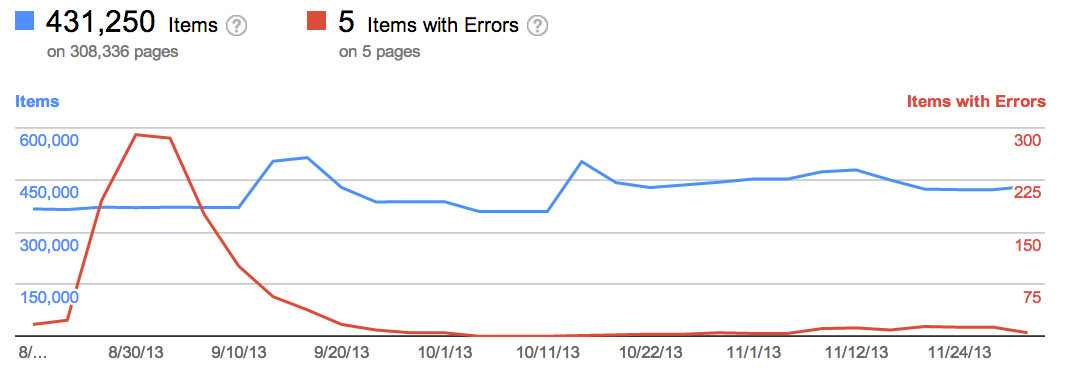
We've added a separate scale for the errors on the right side of the graph in the dashboard, so you can compare items and errors over time. This can be useful to spot connections between changes you may have made on your site and markup errors that are appearing (or disappearing!). Our data pipelines have also been updated for more comprehensive reporting, so you may initially see fewer data points in the chronological graph. How to debug markup implementation errors
We hope this new feature helps you manage the structured data markup on your site better. We will continue to add more error types in the coming months. Meanwhile, we look forward to your comments and questions here or in the dedicated Structured Data section of the Webmaster Help forum.  |


| You are subscribed to email updates from Google Webmaster Central Blog To stop receiving these emails, you may unsubscribe now. | Email delivery powered by Google |
| Google Inc., 20 West Kinzie, Chicago IL USA 60610 | |


